← Back to charts
Chart AI - Análise Técnica icon
APP STORE

Chart AI - Análise Técnica

VIKSVA, MB · Finance · Brazil store
NOT IN TOP 100 HERE
View on App Store ↗ Instagram card Google Play version →
Revenue a month, worldwide EST
$554
Likely $185 to $1.7K
New ratings
+0
in 11 days, 5 in total
Rating
3.0 of 5
1 ratings in this store
Countries it ranks in
3
was 3 on Oct 18, 2026

Revenue

Estimated from the grossing charts of Oct 24, 2026 in the 53 countries we track, and ratings growth on the App Store.

EST. REVENUE / YEAR · WORLDWIDE
$6.6K
Not ranked on Google Play in tracked countries
EST. LIFETIME DOWNLOADS
35 to 100
Estimated from ratings count
WHERE IT EARNS · EST. / MONTH
  • Colombia #41 Finance$554 · 100%
HOW SURE ARE WE
Small app: combines its grossing ranks with ratings growth (0.6 new ratings a month on average since launch). Tested on 418 apps with verified revenue: typically off by about 2.6 times, so the range is wide. Countries we don't track (and Google Play in China, which doesn't exist) aren't included, and neither are ads or web payments. Gross revenue before store fees.
RATINGS
1
AVG RATING
3.00
PRICE
Grátis
AGE
264d
LAST UPDATE
30d ago
VERSION
1.2
SIZE
271 MB
AGE RATING
+4

Last 30 days

From our daily snapshots of every grossing chart and daily ratings counts.

DAYS IN A GROSSING CHART
19 / 30
COUNTRIES NOW
3 (was 0)
NEW RATINGS, LAST 7 DAYS
+0
EST. REVENUE A MONTH, DAILY · BOTH STORES EST
Show daily values
Sep 26, 2026not in a grossing chart
Sep 27, 2026not in a grossing chart
Sep 28, 2026not in a grossing chart
Sep 29, 2026not in a grossing chart
Sep 30, 2026not in a grossing chart
Oct 1, 2026not in a grossing chart
Oct 2, 2026not in a grossing chart
Oct 3, 2026not in a grossing chart
Oct 4, 2026not in a grossing chart
Oct 5, 2026$476 a month
Oct 6, 2026$1.4K a month
Oct 7, 2026$891 a month
Oct 8, 2026$890 a month
Oct 9, 2026not in a grossing chart
Oct 10, 2026not in a grossing chart
Oct 11, 2026not in a grossing chart
Oct 12, 2026not in a grossing chart
Oct 13, 2026not in a grossing chart
Oct 14, 2026$761 a month
Oct 15, 2026$760 a month
Oct 16, 2026$609 a month
Oct 17, 2026not in a grossing chart
Oct 18, 2026not in a grossing chart
Oct 19, 2026not in a grossing chart
Oct 20, 2026not in a grossing chart
Oct 21, 2026not in a grossing chart
Oct 22, 2026not in a grossing chart
Oct 23, 2026not in a grossing chart
Oct 24, 2026$554 a month
Oct 25, 2026not in a grossing chart
The same estimate as the headline, saved every day. Best rank Sep 26, 2026: not ranked. Now: #46 Finance · ZA.
RATINGS IN THE CORE COUNTRIES, DAILY
Show daily values
Oct 13, 20265 ratings
Oct 14, 20265 ratings
Oct 15, 20265 ratings
Oct 16, 20265 ratings
Oct 17, 20265 ratings
Oct 18, 20265 ratings
Oct 19, 20265 ratings
Oct 20, 20265 ratings
Oct 21, 20265 ratings
Oct 22, 20265 ratings
Oct 23, 20265 ratings
Oct 24, 20265 ratings
5 on Oct 13, 2026, 5 on Oct 24, 2026. New ratings track new downloads, even outside the charts.

Money and momentum

Measured from the store, not estimated.

WHAT IT CHARGES
No in-app purchases
Earns from its upfront price, ads or payments outside the store.
REVIEW MOMENTUM
Too few reviews
Fewer than 3 recent written reviews in this country.
RELEASE CADENCE
2 updates in 90 days
  • Typical gap between releases176 days
From the last 3 versions listed on the App Store.
RATING BREAKDOWN
1 ratings
5★0%
4★0%
3★100%
2★0%
1★0%

Apps like this

Same category, earning about as much.

Store screenshots

ScreenshotScreenshotScreenshotScreenshotScreenshotScreenshotScreenshotScreenshotScreenshotScreenshot

App Store ads

Apple Search Ads this app ran in the last 90 days, from Apple's public ad repository.

No App Store ads in the EU
None in the last 90 days.

Apple only publishes ads shown in the EU (EU Digital Services Act), with a 7 day delay. An app that advertises only outside the EU shows nothing here.

Growth research

Where this app is buying and earning its users. Each link opens pre filtered.

ASO keywords

Most repeated terms in the listing. Highlighted ones also appear in the title.

lise10para9ncia8veis7tend ncia6trading6qualquer5fico5dire tend5chart4opera4tend4timeframe4sua4lises4capture qualquer3qualquer fico3lise cnica3cnica detalhada3suporte resist3resist ncia3bandas bollinger3dias veis3multi timeframe3

What's new in 1.2

Correções de bugs e melhorias de desempenho.

Released Feb 3, 2026. Current version shipped Sep 25, 2026.

Store description

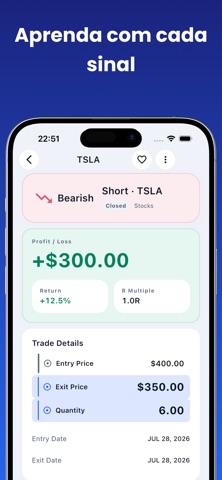
Chart AI analisa seus gráficos de trading usando inteligência artificial. Simplesmente capture qualquer gráfico e obtenha análise técnica detalhada com indicadores, padrões e níveis de operação. ANÁLISE DE GRÁFICOS COM IA • Escaneie qualquer captura de gráfico do TradingView, MT4, MT5 ou qualquer plataforma • A IA analisa padrões de candles, price action e estrutura de mercado • Identificação automática de níveis de suporte e resistência • Análise de direção e força da tendência • Leituras de RSI, MACD, Bandas de Bollinger e Médias Móveis ANÁLISE MULTI-TIMEFRAME • Analise dois timeframes simultaneamente para confluência • Timeframe maior para direção da tendência (Diário, Semanal, Mensal) • Timeframe menor para timing de entrada (4H, 1H, 15M, 5M, 1M) • Veja como os timeframes se alinham para setups mais fortes INDICADORES TÉCNICOS • RSI - Condições de sobrecompra/sobrevenda e divergências • MACD - Momentum de tendência e sinais de cruzamento • Bandas de Bollinger - Volatilidade e análise de posição do preço • Médias Móveis - Direção da tendência e suporte/resistência dinâmico • Análise de volume quando visível no gráfico ANÁLISE DE OPERAÇÕES • Níveis de entrada, stop-loss e take-profit • Cálculo de relação risco/recompensa • Pontuação de confiança para cada análise • Cenários de alta e baixa • Níveis-chave para observar DIÁRIO DE OPERAÇÕES • Registre suas operações e mantenha tudo em um só lugar • Acompanhe sua taxa de acerto e seus resultados • Consulte o histórico das suas análises quando quiser FUNCIONA COM TODOS OS MERCADOS • Ações - S&P 500, NASDAQ, NYSE, B3, bolsas globais • Criptomoedas - Bitcoin, Ethereum, altcoins • Forex - Pares de moedas maiores, menores e exóticos • Commodities - Ouro, prata, petróleo, gás natural • Índices - SPX, DJI, IBOV, DAX, Nikkei COMO FUNCIONA 1. Capture qualquer gráfico da sua plataforma de trading 2. Abra o Chart AI e selecione ou capture a imagem 3. A IA processa o gráfico e identifica padrões 4. Revise a análise técnica detalhada 5. Use os insights para sua pesquisa de trading GRÁTIS E PREMIUM Grátis: Análises diárias limitadas Premium: Análise IA ilimitada, escaneamento multi-timeframe, suíte completa de indicadores PRIVACIDADE Suas capturas de gráficos são processadas de forma segura. Não compartilhamos seus dados de trading ou histórico de análises com terceiros. --- AVISO IMPORTANTE Chart AI é projetado apenas para fins educacionais e informativos. As análises, sinais e informações fornecidas por este app não constituem aconselhamento financeiro, de investimento, de trading ou qualquer outra forma de aconselhamento profissional. Operar ações, criptomoedas, forex e outros instrumentos financeiros envolve risco substancial de perda e não é adequado para todos os investidores. Desempenho passado não garante resultados futuros. Você nunca deve operar com dinheiro que não pode se dar ao luxo de perder. Sempre conduza sua própria pesquisa e consulte um consultor financeiro qualificado antes de tomar decisões de investimento. Os desenvolvedores do Chart AI não são responsáveis por quaisquer perdas de trading incorridas. --- Termos de Serviço: https://apps.viksva.com/chartsai/chartai_terms.html Política de Privacidade: https://apps.viksva.com/chartsai/chartai_privacy.html

See this store page in another country

Prices, ranks and reviews are per country. Revenue above is already worldwide.