← Back to charts
Buffett Indicator icon
APP STORE

Buffett Indicator

LuLu-Ventures-LLC · Finance · Germany store
NOT IN TOP 100 HERE
View on App Store ↗ Instagram card
Revenue a month, worldwide
Too small to estimate
Not enough chart or ratings data
New ratings
+1
in 3 days, 13 in total
Rating
0.0 of 5
0 ratings in this store
Countries it ranks in
0
was 0 on Oct 17, 2026

Revenue

Estimated from the grossing charts of Oct 24, 2026 in the 53 countries we track, and ratings growth on the App Store.

EST. REVENUE / MONTH · WORLDWIDE
Unranked
Not in any grossing chart, and too few ratings (12) to read its growth. Most apps at this stage earn little or nothing.
EST. LIFETIME DOWNLOADS
n/a
Estimated from ratings count
RATINGS
0
AVG RATING
n/a
PRICE
9,99 €
AGE
1.2y
LAST UPDATE
20d ago
VERSION
6.5
SIZE
23 MB
AGE RATING
4+

Last 30 days

From our daily snapshots of every grossing chart and daily ratings counts.

DAYS IN A GROSSING CHART
1 / 30
COUNTRIES NOW
0 (was 0)
NEW RATINGS, LAST 3 DAYS
+1
EST. REVENUE FROM CHARTS, DAILY · APP STORE ONLY EST
Show daily values
Sep 25, 2026not in a grossing chart
Sep 26, 2026not in a grossing chart
Sep 27, 2026not in a grossing chart
Sep 28, 2026not in a grossing chart
Sep 29, 2026not in a grossing chart
Sep 30, 2026not in a grossing chart
Oct 1, 2026not in a grossing chart
Oct 2, 2026not in a grossing chart
Oct 3, 2026not in a grossing chart
Oct 4, 2026not in a grossing chart
Oct 5, 2026not in a grossing chart
Oct 6, 2026not in a grossing chart
Oct 7, 2026not in a grossing chart
Oct 8, 2026not in a grossing chart
Oct 9, 2026not in a grossing chart
Oct 10, 2026not in a grossing chart
Oct 11, 2026not in a grossing chart
Oct 12, 2026not in a grossing chart
Oct 13, 2026not in a grossing chart
Oct 14, 2026not in a grossing chart
Oct 15, 2026not in a grossing chart
Oct 16, 2026not in a grossing chart
Oct 17, 2026not in a grossing chart
Oct 18, 2026not in a grossing chart
Oct 19, 2026not in a grossing chart
Oct 20, 2026not in a grossing chart
Oct 21, 2026$1.7K · 1 country
Oct 22, 2026not in a grossing chart
Oct 23, 2026not in a grossing chart
Oct 24, 2026not in a grossing chart
Best rank Sep 25, 2026: not ranked. Now: not ranked. Days at zero are days outside every grossing chart.
RATINGS IN THE CORE COUNTRIES, DAILY
Show daily values
Oct 21, 202612 ratings
Oct 22, 202612 ratings
Oct 23, 202612 ratings
Oct 24, 202613 ratings
12 on Oct 21, 2026, 13 on Oct 24, 2026. New ratings track new downloads, even outside the charts.

Money and momentum

Measured from the store, not estimated.

WHAT IT CHARGES
No in-app purchases
Earns from its upfront price, ads or payments outside the store.
REVIEW MOMENTUM
0.0 reviews / week
  • Recent reviews average5.0 stars
  • Recent 1 and 2 star share0%
From the latest 3 written reviews, covering 449 days.
RELEASE CADENCE
2 updates in 90 days
  • Typical gap between releases31 days
From the last 12 versions listed on the App Store.

What users say

Latest reviews, Germany App Store.

★★★★★Aug 10, 2025
I like this app

Very clean and exactly what I want, I can also add widget to my Home Screen

★★★★★Aug 9, 2025
Review

Simple and works

★★★★★Aug 1, 2025
Must have!

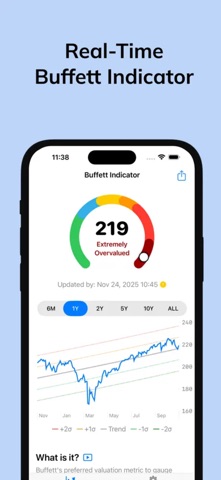
Buffett Indicator is a must-have for long-term investors, value analysts and macroeconomics enthusiasts. It simplifies the notoriously broad Buffett Indicator into a clean, digestible format with real-time updates and intuitive values!
Store screenshots

ScreenshotScreenshotScreenshotScreenshotScreenshot

App Store ads

Apple Search Ads this app ran in the last 90 days, from Apple's public ad repository.

No App Store ads in the EU
None in the last 90 days.

Apple only publishes ads shown in the EU (EU Digital Services Act), with a 7 day delay. An app that advertises only outside the EU shows nothing here.

Growth research

Where this app is buying and earning its users. Each link opens pre filtered.

ASO keywords

Most repeated terms in the listing. Highlighted ones also appear in the title.

die8der4und4langfristige anleger3verh ltnis3die daten3buffett3vergleich3des3wie2ist2auf2langfristige2anleger2heutige2jahrzehnten2steht2wilshire2verh2ltnis2bip2aktualisiert2daten2keine2

What's new in 6.5

Die App-Store-Seite gibt es jetzt in 11 weiteren Sprachen, darunter Deutsch: dieselben Sprachen, die die App bereits unterstützt.

Released Aug 1, 2025. Current version shipped Oct 4, 2026.

Store description

Wie teuer ist der US-Aktienmarkt heute? Buffett Indicator verfolgt die beiden Bewertungskennzahlen, auf die langfristige Anleger am meisten achten, und zeigt, wo der heutige Wert im Vergleich zu Jahrzehnten Marktgeschichte steht. FUNKTIONEN • Buffett-Indikator: der Gesamtwert des US-Aktienmarkts (Wilshire 5000) im Verhältnis zum US-BIP, täglich aktualisiert • Shiller-KGV (CAPE): das zyklisch bereinigte Kurs-Gewinn-Verhältnis des S&P 500, mit über 140 Jahren Historie • Historischer Vergleich: So steht die heutige Bewertung im Vergleich zu früheren Jahrzehnten • Bewertungsanzeigen: Farbbereiche zeigen auf einen Blick, wie hoch der Markt bewertet ist • Widget für den Home-Bildschirm: die aktuellen Werte, ohne die App zu öffnen • Tägliche Benachrichtigung, sobald die Zahlen aktualisiert sind Für langfristige Anleger und Makro-Beobachter, die Daten statt Schlagzeilen wollen. Die Daten stammen aus öffentlichen Quellen: Wilshire 5000, US-BIP und Gewinne des S&P 500. Nur zu Informations- und Bildungszwecken; keine Anlageberatung. Keine Verbindung zu Warren Buffett oder Berkshire Hathaway.

See this store page in another country

Prices, ranks and reviews are per country. Revenue above is already worldwide.

More from LuLu-Ventures-LLC

DeepValues: Anlegen wie Profis
Finance
0 ratingsAnalyze →
WarmLight: Night Light & Sound
Utilities
0 ratingsAnalyze →