ASO keywords
Most repeated terms in the listing. Highlighted ones also appear in the title.
charts8growth7growth charts6age5weight5charts calculations5head circumference5based4growth velocity3calculations based3length weight3cerebral palsy3tube fed3daily fluid3patient database3import export3down syndrome3calculates3analysis3calculations3length3height3bmi3head3
What's new in 2.3
» The new 3rd generation Fenton curves for assessing and monitoring the growth of premature babies have been incorporated, integrated with World Health Organization (WHO) standards. These include:
1. Day-to-day monitoring curves, which allow for the accurate calculation of percentiles and Z-scores throughout postnatal growth.
2. “At Birth” curves, based on full weeks of gestation, ideal for assessment at the time of birth.
» CDC growth curves have been added, expanding coverage for child growth assessment.
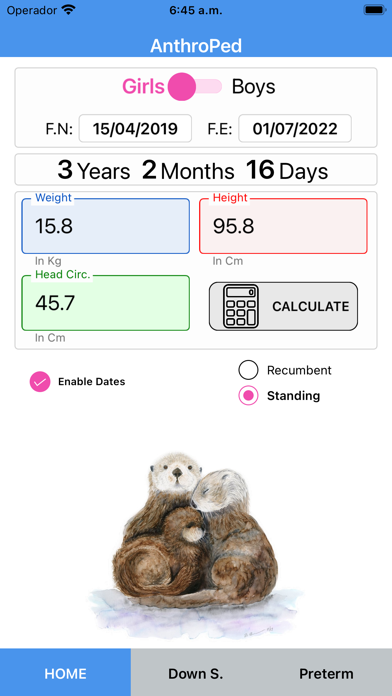
It performs graphs and calculations of percentiles and Z-scores according to WHO/CDC parameters, with sensitivity based on days of life, ensuring a more accurate and clinically relevant growth assessment in the following indicators:
1. Weight/Height
2. Weight/Age
3. Height/Age
4. BMI/Age (extended)
5. Head Circumference/Age
» You can now generate PDFs and share reports containing anthropometric data, results, percentiles, Z-scores, and growth charts (CDC, WHO).
Released Jan 20, 2022. Current version shipped Oct 17, 2026.
Store description
This application calculates and graphically displays the Z-Score and percentile of the main anthropometric indicators across the entire pediatric age range. It also performs a detailed analysis of growth velocity, using days of life as the reference. It was developed and programmed by Gerson Rodríguez, Pediatric Specialist.
Main Features
1. Percentile and Z-Score Charts and Calculations (WHO / CDC): Charts and calculations based on WHO and CDC standards, with day-of-life sensitivity, to ensure accurate growth assessment for:
Weight / Length
Weight / Age
Length (Height) / Age
BMI / Age
Head Circumference / Age
2. Growth Velocity Analysis: Evaluates changes in length, weight, or head circumference, displaying Z-scores, percentiles, and graphs that highlight progress between visits.
2.1 Quantitative deficit or excess analysis: For each indicator, the app calculates the exact difference between the child and each standard deviation curve (–3 to +3 SD).
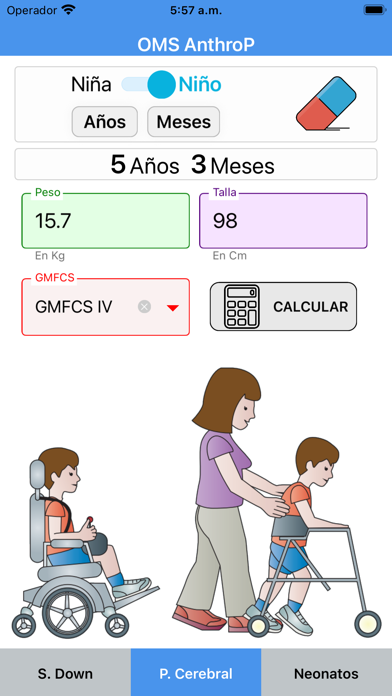
3. Cerebral Palsy Growth Charts Includes weight, height, and BMI charts for children with Cerebral Palsy, stratified by the Gross Motor Function Classification System (GMFCS I–V), with Level V divided into tube-fed (TF) and non-tube-fed (NT).
Based on: Jordan Brooks et al., Pediatrics 128(2): e299–e307.
4. Daily Fluid Requirement Calculation: Calculates daily fluid needs using the Holliday & Segar method or body surface area.
5. Patient Database Management: Create and manage patient records including percentiles, Z-scores, and anthropometric measurements for comprehensive follow-up.
6. Import and Export Data: Easily import and export the patient database for flexible data management.
7. Preterm and Neonatal Growth Charts: Charts and calculations based on the latest FENTON, INTERGROWTH-21st, and OLSEN (2010) references.
8. Down Syndrome Growth Charts: Growth charts specially adapted for children with Down syndrome.
All results are based on the LMS model (Cox distribution: Lambda – Mu – Sigma), applied to height, weight, BMI, and head circumference.
Access all features with a single purchase, including future updates at no additional cost.
No internet connection required — use it anywhere.
See this store page in another country
Prices, ranks and reviews are per country. Revenue above is already worldwide.