ASO keywords
Most repeated terms in the listing. Highlighted ones also appear in the title.
air quality6pollen5air4quality4sydney pollen3pollen count3count forecast3allergy management3sydney3forecast3data3forecasts3insights3survey3allergy3allergies2count2monitoring2allergens2grass2mould2days2access2ensuring2
What's new in 3.0.2
This update makes symptom logging faster, map insights clearer, and sharing more convenient.
A clearer map
• Report markers now cluster automatically, reducing overlap at lower zoom levels.
• The timeline starts collapsed and expands when playback begins.
• Tap a group of symptom reports to view the severity distribution and switch between Time, Age and Gender breakdowns.
Faster daily check-ins
• Dashboard and Me now include a simple smiley check-in for recording how you feel. A brief acknowledgment is shown the first time you use it.
• With location enabled, your check-in is saved immediately, with options to undo or continue adding details. Without location, your selection is not saved until you continue and complete the log.
• Your Dashboard selection carries over to Me, resumes after the smiley question, and tracks daily completion separately for each profile.
• A new floating shortcut and one-question-at-a-time flow make full reports easier to complete.
Easier sharing
• Share tiles directly from More.
• After taking a screenshot on Dashboard or a Measure detail screen, you can choose to create a share card.
A refreshed Me and Communities
• Me is now focused on your personal symptoms. Review your history and compare it with averages for your selected location, with a layer selector for different comparisons.
• Communities brings community news and updates together in one place.
More improvements
• Added support for iOS Home Screen widgets.
• Improved loading states, layout and overall stability across Dashboard and Measure details.
Released Sep 13, 2015. Current version shipped Aug 24, 2026.
Store description
Say goodbye to sneezes and sniffles! Gain the upper hand against allergies with the Sydney Pollen Count and Forecast App. Armed with data from an extensive monitoring network, this app provides you with precise forecasts for a wide array of allergens including grass, trees, mould, and more.
Key Features:
Comprehensive Allergen Forecasts: From grass pollen to mold spores, get accurate predictions to plan your days with confidence.
Air Quality Insights: Access real-time air quality data from EPA monitoring sites, ensuring you have a complete environmental picture.
Year-Round Coverage: Enjoy uninterrupted access to our long-range forecast, tailored to Sydney's unique climate and covering a variety of allergens.
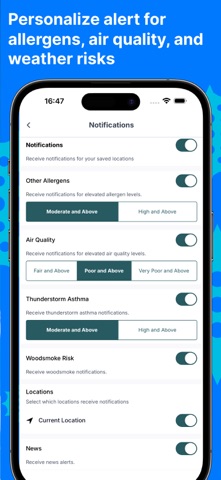
Proactive Notifications: Receive timely alerts for predicted high pollen days and poor air quality, empowering you to make informed decisions.
Hay Fever Survey: Your input matters! Share your experiences through our survey, contributing to ongoing research for better allergy management.
Why Choose Us?
Developed in Collaboration: Backed by health authorities, we're committed to your well-being and have partnered closely with experts to provide you with the best allergy management tools.
Holistic Approach: Beyond pollen counts, we offer insights into mould, air quality, and more, ensuring you're equipped to navigate any environmental challenge.
Data-Driven Insights: Your responses to our survey play a crucial role in refining our forecasts, benefiting allergy sufferers across the board.
Don't let allergies hold you back! Download the Sydney Pollen Count and Forecast App now and take control of your well-being. Together, let's build a healthier, more informed community.
See this store page in another country
Prices, ranks and reviews are per country. Revenue above is already worldwide.